> For the complete documentation index, see [llms.txt](https://docs.aqua-cloud.io/documentation/llms.txt). Markdown versions of documentation pages are available by appending `.md` to page URLs; this page is available as [Markdown](https://docs.aqua-cloud.io/documentation/desktop-client/agile-board/burn-down-chart.md).
# Burn Down Chart
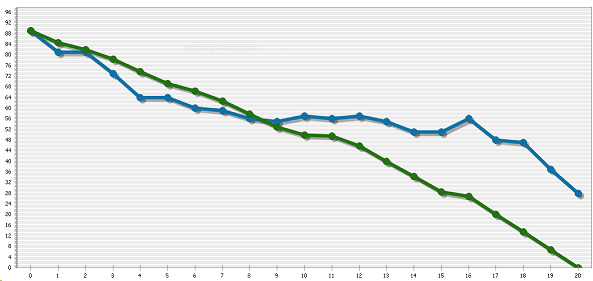
This is a burn down chart that tracks the actual progress of your development tasks. When an item has a Definition Of Done status, you can see that the progress is going down point by point.
The green line is the optimal line giving you an overview if your progress (the blue line) is just in time.
---
# Agent Instructions
This documentation is published with GitBook. GitBook is the documentation platform designed so that both humans and AI agents can read, navigate, and reason over technical content effectively. Learn more at gitbook.com.
## Querying This Documentation
If you need additional information that is not directly available in this page, you can query the documentation dynamically by asking a question.
Perform an HTTP GET request on the current page URL with the `ask` query parameter:
```
GET https://docs.aqua-cloud.io/documentation/desktop-client/agile-board/burn-down-chart.md?ask=
```
The question should be specific, self-contained, and written in natural language.
The response will contain a direct answer to the question and relevant excerpts and sources from the documentation.
Use this mechanism when the answer is not explicitly present in the current page, you need clarification or additional context, or you want to retrieve related documentation sections.