Dashboard
In the Dashboard module, the user can monitor the business process of individual fields and status that can be combined with individual Views.
That gives a project manager, test manager, or others the powerful option to monitor the (actual) business development and test process of actual key values. There are three steps you will have to undertake if you are within the Dashboard.

1st step: define how many charts are needed. Use the Number of Charts button to do so. 
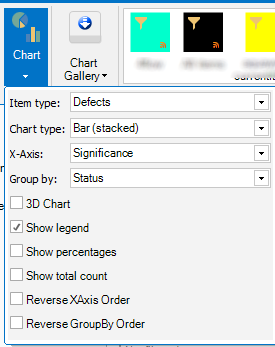
2nd step: choose a chart and click on it. Click on the Chart button to define item type and chart type, and define the other fields classifying the graph.

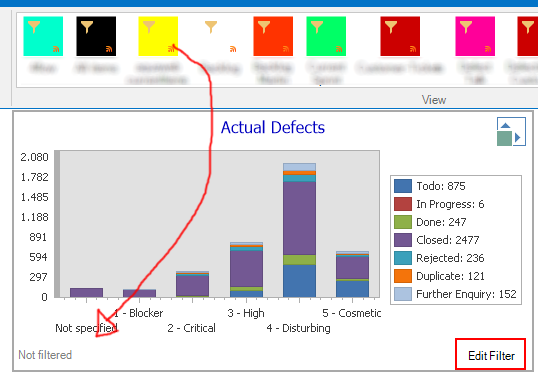
3rd step: combine the chart with a filter. Click on a filter in Views or edit the filter in the dashboard.

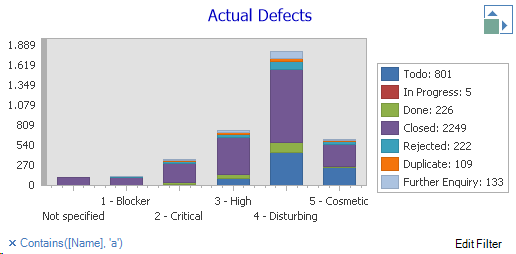
After having clicked on OK, the filter is displayed in the dashboard.

Last updated
Was this helpful?